pyDataVis is an open source software written in pure Python. Thus it can run on Windows, Linux/Unix and macOS.
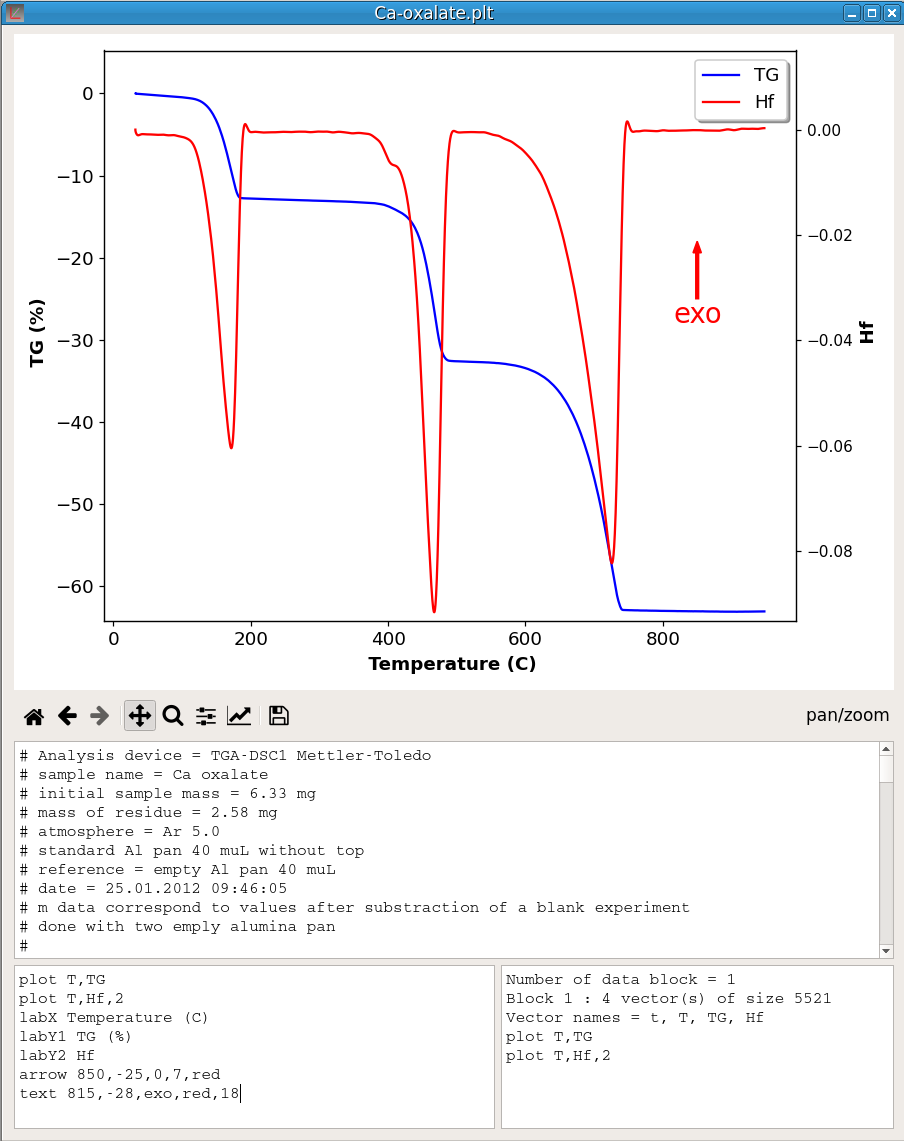
There are many free plotting sofware most of them far more powerful than pyDataVis. However, in terms of simplicity, it is hard to beat. Indeed it is very easy to use, just drag and drop your data file in pyDataVis window and immediately you are seeing the curves. For now, pyDataVis is limited to 2D plotting.